

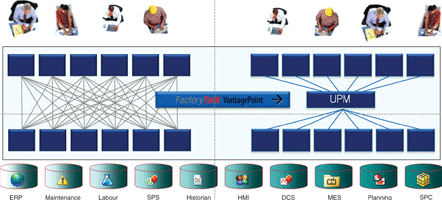
Modern breweries and bottling plants are increasingly turning to EMI (enterprise manufacturing intelligence) systems to manage data from the diverse IT systems used in their production processes. FactoryTalk VantagePoint from Rockwell Automation helps optimise production costs, maintain product quality and increase operational visibility by providing flexible Web-based management tools to monitor, correlate and share data.
The preparation and correlation of data from diverse sources in breweries is becoming increasingly important. With the increase in energy costs, breweries are beginning to notice that the relationships between certain processes in different departments may be leading to unfavourable load and power consumption peaks.
Breweries use a wide range of IT systems that help management monitor and optimise processes, while at the same time supporting the documentation and analysis of company procedures. As most breweries have grown they have tended to use multiple standalone systems from different vendors.
Often, the integration between these standalone systems is non-existent or limited to one or two application areas. However, optimising processes to save energy, streamline activities and maintain quality requires a high level of flexibility as far as sharing and viewing data are concerned. Brewers need to be able to easily check the correlation between their energy consumption and processes in the brew house and bottling room, or to superimpose and compare process diagrams with lab test results. They need tools to verify suspected correlations, portray known correlations and produce reports on them for different types of users throughout the company.
When companies want to achieve this, they often just copy the data out of the standalone systems into a new database and add a reporting system to it. This method of operation is prone to error and requires a high degree of maintenance.
The reporting system’s level of flexibility may also be limited to the exact requirements stipulated by the brewery when the system was ordered. If breweries want additional functions, such as the integration of manually entered data from the ubiquitous Excel spreadsheets, they will probably need to pay for additional engineering work by the system vendor.
Rockwell Automation’s EMI system – FactoryTalk VantagePoint – takes a different approach to solving this challenge. The system helps avoid unnecessary data redundancy in the company and offer users flexibility when working with data. It also makes it easy for users to add new functions as they are required, and to work with familiar tools like Microsoft Excel.
The system also facilitates the generation and distribution of reports by being fully Web-based. As a result, users can manage, create and publish reports using a Web browser such as Microsoft’s Internet Explorer. The simple, customisable Web portal helps make system administration easy for companies with several production sites. This is because they only need one server in one location and it can be accessed by all the other sites.
To help achieve the goal of flexibility, FactoryTalk VantagePoint allows users to create logical models representing the brewery with its different departments and the equipment within them. Users can also generate other types of models, such as operations or management-related ones, which can exist in parallel with the brewery models. The logical models can be as simple or as detailed as needed.
To work effectively with the model, the attributes need to be populated with data by connecting each one to the relevant data source in the company. Another inherent strength is the provision of predefined connectors to several common systems, including SQL and Oracle databases, OPC interfaces and OSIsoft PI systems, as well as to the Rockwell Automation FactoryTalk platform. Connecting a data source to an attribute is often a simple matter of selecting the necessary information by dragging and dropping. This means that users can create models without needing detailed knowledge of the supporting data sources or of the technology underpinning data entry and transmission. Using the model, practically anyone in the company is capable of producing new reports or trend charts without special training.
The trend tool is available on the Web portal and lets users combine different attributes in a trend chart by simple drag-and-drop techniques, and then allows them to check for possible correlations. It makes no difference whether the attributes come from the same piece of equipment in the same time period or from separate systems. As a result, users can superimpose values that do not appear to be related. This makes it easier for users to identify the cause of load peaks.
Users can also combine observations from different time periods in a trend chart, helping them to ascertain the impact of a process, which may have delayed effects. The sole limitation is that users can only work with the elements previously created in the model. For processes influenced by temperature, air pressure and humidity, an interesting option would be to include weather conditions as an element in the model. The data source here could be a public weather database on the Internet. The system also allows users to compare different process diagrams from individual batches. If they identify a batch that was of particularly good quality or produced with unusually low power consumption, they can define this batch as a yardstick or ‘golden batch’. The golden batch parameters can be permanently displayed behind data from the current batches. This helps users to spot differences between the optimal and the current batch, and react accordingly.
Alongside the observation of current trends, the consolidation of data into meaningful reports is another important factor that helps users evaluate and optimise processes. FactoryTalk VantagePoint helps make it easy for users to create new reports themselves, in addition to the report formats provided with the system as part of the implementation. This flexibility is valuable in today’s constantly changing business world. Users may need to compare separate sets of performance indicators after production, or they may require different types of reports for new product ranges or equipment. Alternatively, they may want to shift the focus of a process in light of price structure changes in the market.
Guided by a wizard, users can import data from the FactoryTalk VantagePoint model into Microsoft Excel and edit, consolidate and visualise the data using Excel functions. The data used is not a static copy, but rather a link to the relevant data source. As a result, it is possible to create dynamic reports, such as energy consumption during the last hour, which can be updated when required. If reports need to be made available to several people, it is not necessary to send them to each person by e-mail. Instead, they can be published on the Web portal and made accessible to each recipient using access permissions.
On the portal, the report structure is saved within the model, which itself is saved on the server. When an authorised user accesses the report through his/her browser, it can be generated dynamically using the relevant data sources. The report can also be updated periodically in Internet Explorer, so that users always have the most current data on hand. Static Excel reports, created before the implementation of the EMI system, can also be stored in the model. This helps ensure that people do not spend time creating reports when a trusted version already exists.
The online update capability illustrates how data can be accessed in real-time. Along with its use in reports and trend charts, it is also useful for dashboards. These can be set up as dynamic Web pages where people can view up-to-date information and drill down into the details using Web links.
Users can work with the system without needing any knowledge of the original data source, because they create trend charts and reports directly within the model. As it is so easy to combine data from different systems, users can examine process relationships that previously went unnoticed and act accordingly to optimise the processes concerned. They can quickly create reports with Microsoft Excel and publish them on the relevant Web portal, providing an efficient and targeted way to distribute reports and key figures.
For more information contact Sean Homan, Rockwell Automation, +27 (0)11 654 9700, [email protected], www.rockwellautomation.co.za
| Tel: | +27 11 654 9700 |
| Email: | [email protected] |
| www: | www.rockwellautomation.co.za |
| Articles: | More information and articles about Rockwell Automation |


© Technews Publishing (Pty) Ltd | All Rights Reserved
 printer friendly version